Mapping Democratic Strength
In the United States, political affiliation often falls along two broad lines: the Democratic Party, generally associated with liberal or progressive positions, and the Republican Party, aligned with conservative or right-leaning views. States differ widely in how strongly they lean toward either side — a pattern shaped by history, demographics, and regional values.
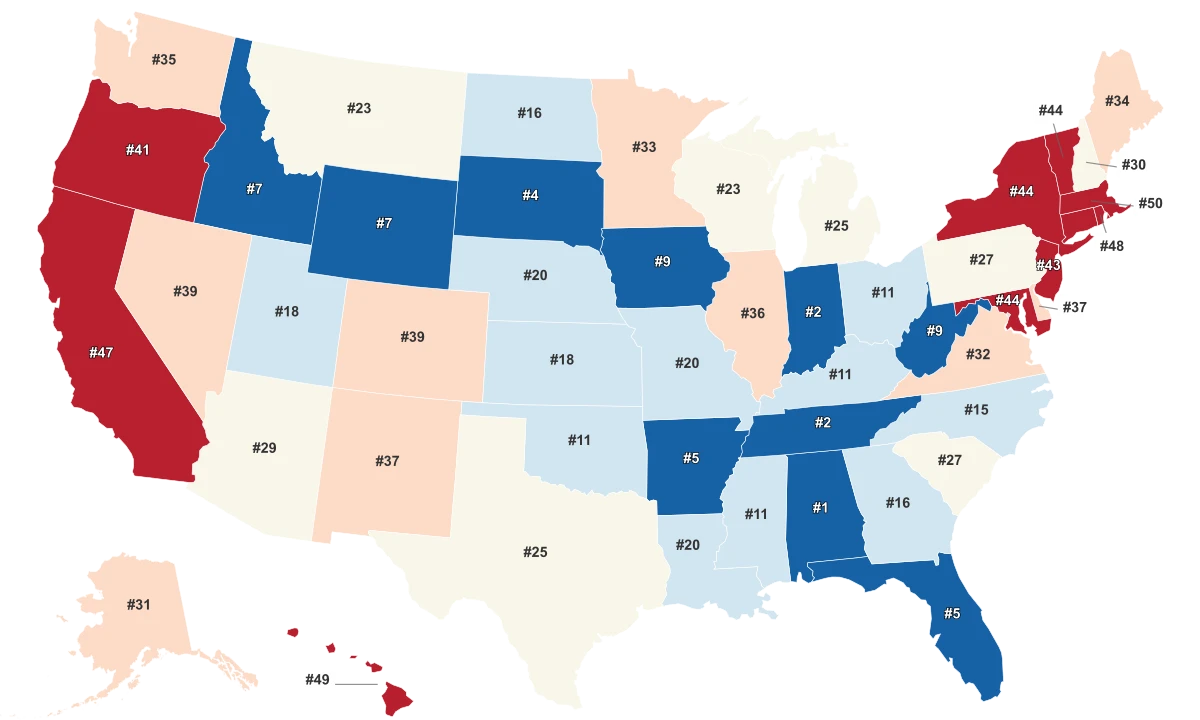
This ranking looks at how Democratic each state truly is, using two complementary measures from the 2024 presidential election:
Vote share — the percentage of ballots cast for the Democratic candidate, Kamala Harris.
Party registration — the proportion of voters officially registered as Democrats in 2024.
Together, these patterns highlight how registration reflects party identity, while vote share reveals political reality. The data show a country increasingly polarized by region — strong Democratic support along the coasts and in major cities, weaker in the rural interior — and a political map where traditional party lines no longer tell the full story.
Key Findings
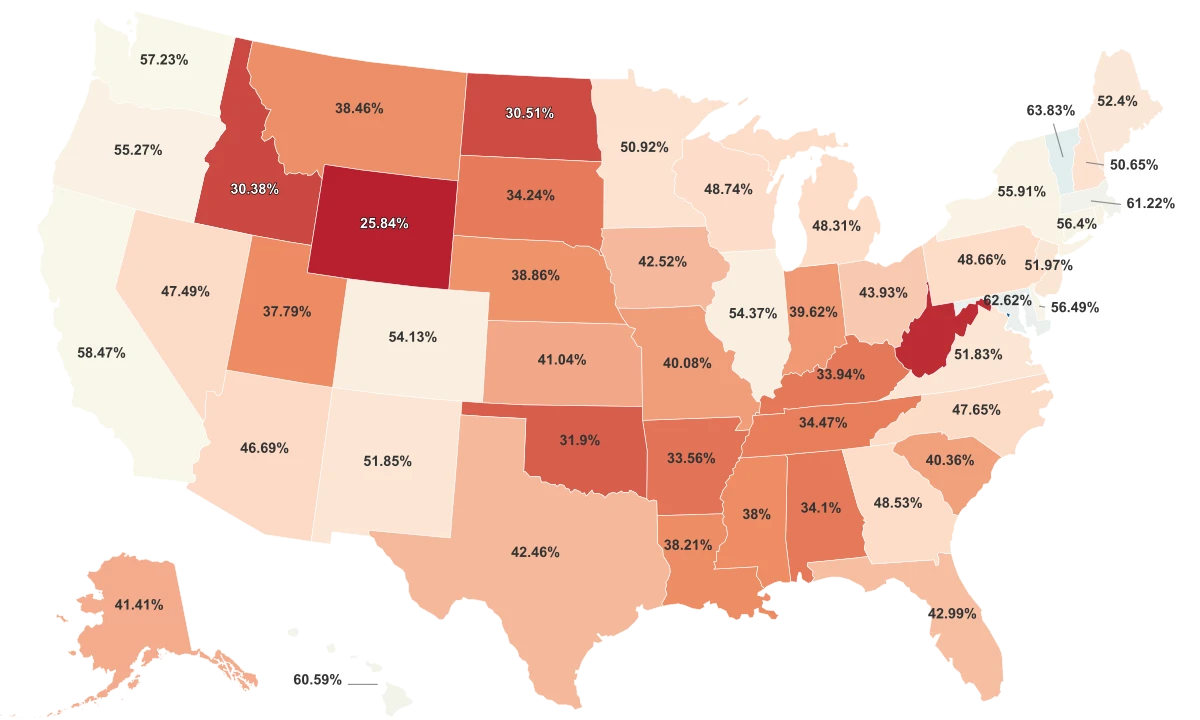
- Hawaii is the most Democratic state in 2024, with over 63% of votes for the Democratic candidate — the highest share nationwide.
- Maryland and Massachusetts follow closely, both with around 60% Democratic support and high rates of registered Democrats, confirming their long-standing alignment with the party.
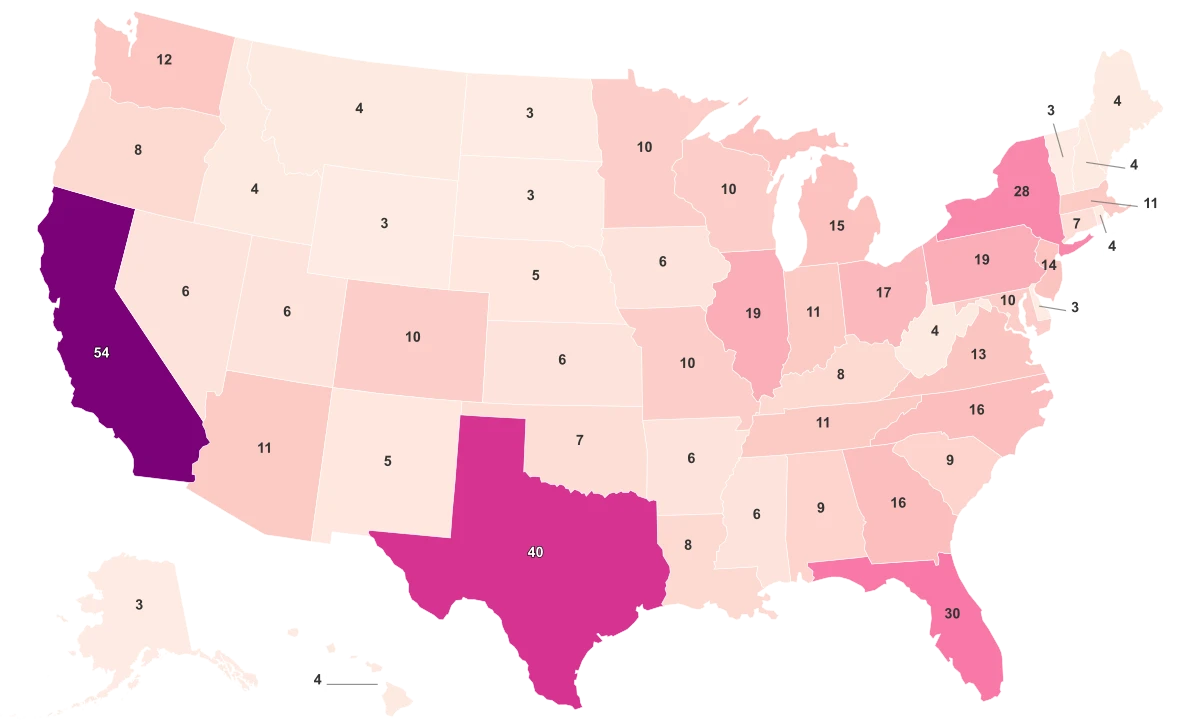
- California and New York remain Democratic strongholds, each delivering major vote margins that account for a significant share of national Democratic totals.
- Wyoming ranks as the least Democratic state, with just 25.8% voting Democratic and 11% registered Democrats, marking the lowest measured levels of support.
- West Virginia and Kentucky stand out for their mismatch between registration and voting: large numbers of registered Democrats but far fewer Democratic votes, showing a clear long-term shift in political loyalty.
- Overall, Democratic strength is concentrated in fewer but more consistent states, especially along the East and West Coasts, while support remains limited across the central and mountain regions.
Top 10 Democratic States
District of Columbia
Harris captured 90.28 % of the vote. The district’s urban, federal, and administrative character make it strongly Democratic in virtually all elections.Vermont
Harris received 63.83 %. Once more rural and mixed politically, Vermont has over the past decades shifted toward progressive and liberal consensus politics.Maryland
Harris won 62.62 %. Proximity to Washington, D.C., high levels of federal and academic employment, and well-funded public services help anchor a strong Democratic coalition.Massachusetts
Harris got 61.22 %. The state’s long liberal tradition—support for education, health, social policy—is deeply embedded in its institutions and civic culture.Hawaii
Harris managed 60.59 % there. Hawaii has voted Democrat in all but two presidential elections (1972 and 1984), reinforcing its status as one of the most reliably Democratic jurisdictions.California
Harris earned 58.47 %. With a large, diverse electorate and significant crossover support, California remains central to any Democratic electoral strategy.Washington (state)
Harris won 57.23 %. Democratic strength is concentrated in the western, urbanized parts of the state; more rural eastern regions tend to lean Republican.Delaware
Harris got 56.49 %. As a smaller state, Delaware’s political dynamics often reflect suburban liberalism and stability in voter alignments.Connecticut
Harris earned 56.40 %. Connecticut’s proximity to larger Northeast population centers and its suburban profile support consistent Democratic outcomes.New York
Harris won 55.91 %. New York City and metropolitan areas dominate statewide results—even with upstate areas being more moderate, the city’s turnout keeps the state reliably Democratic.
| Rank | State / District | Democratic Vote Share 2024 | % Registered Democrats 2024 |
|---|---|---|---|
| 1 | District of Columbia | 90.28 % | 76.2 % |
| 2 | Vermont | 63.83 % | — |
| 3 | Maryland | 62.62 % | 52.5 % |
| 4 | Massachusetts | 61.22 % | 26.3 % |
| 5 | Hawaii | 60.59 % | — |
| 6 | California | 58.47 % | 46.2 % |
| 7 | Washington (state) | 57.23 % | — |
| 8 | Delaware | 56.49 % | 44.9 % |
| 9 | Connecticut | 56.40 % | — |
| 10 | New York | 55.91 % | 48.9 % |
Bottom 10 Democratic States
Wyoming
Harris got 25.84 %. Wyoming has not supported a Democratic presidential candidate since 1964, reflecting a very weak institutional Democratic presence.West Virginia
Harris captured 28.10 %. Historically part of the Democratic labor-coal stronghold, the state has realigned sharply Republican in recent decades.Idaho
Harris got 30.38 %. The Democratic base is limited, often restricted to urban centers and university towns, while large rural areas remain strongly Republican.North Dakota
Harris received 30.51 %. Because North Dakota does not require partisan registration, vote share is the key measure of Democratic influence there.Oklahoma
Harris reached 31.90 %. Although conservative overall, party registration (~27.5 %) indicates some base Democratic identity, even in a red state.Arkansas
Harris got 33.56 %. The state has shifted more Republican in national races—Democratic strength now is largely local or implicit.Kentucky
Harris managed 33.94 %. In many areas, Democratic registration persists from prior generations, even as federal elections skew Republican.Alabama
Harris got 34.10 %. The state has been reliably Republican at the presidential level for many cycles; Democratic chances in federal races are limited.South Dakota
Harris took 34.24 %. Voter registration data (~21.3 %) suggests a meaningful formal Democratic presence compared to vote share, indicating underperformance in turnout or crossover loss.Tennessee
Harris got 34.47 %. The state has trended Republican in presidential elections for decades; local Democrats sometimes secure legislative wins but rarely at the top of the ticket.
| Rank | State | Democratic Vote Share 2024 | % Registered Democrats 2024 |
|---|---|---|---|
| 1 | Wyoming | 25.84 % | 11.1 % |
| 2 | West Virginia | 28.10 % | 29.6 % |
| 3 | Idaho | 30.38 % | 12.6 % |
| 4 | North Dakota | 30.51 % | — |
| 5 | Oklahoma | 31.90 % | 27.5 % |
| 6 | Arkansas | 33.56 % | — |
| 7 | Kentucky | 33.94 % | 42.9 % |
| 8 | Alabama | 34.10 % | — |
| 9 | South Dakota | 34.24 % | 21.3 % |
| 10 | Tennessee | 34.47 % | — |