Most Liberal States
48.5Liberal RankingNational Average
-3.56Cook Partisan Voter IndexNational Average
46.49%Harris VotesNational Average
—Governor Political Party
Liberal Ranking
Last updated February 28, 2026
Introduction
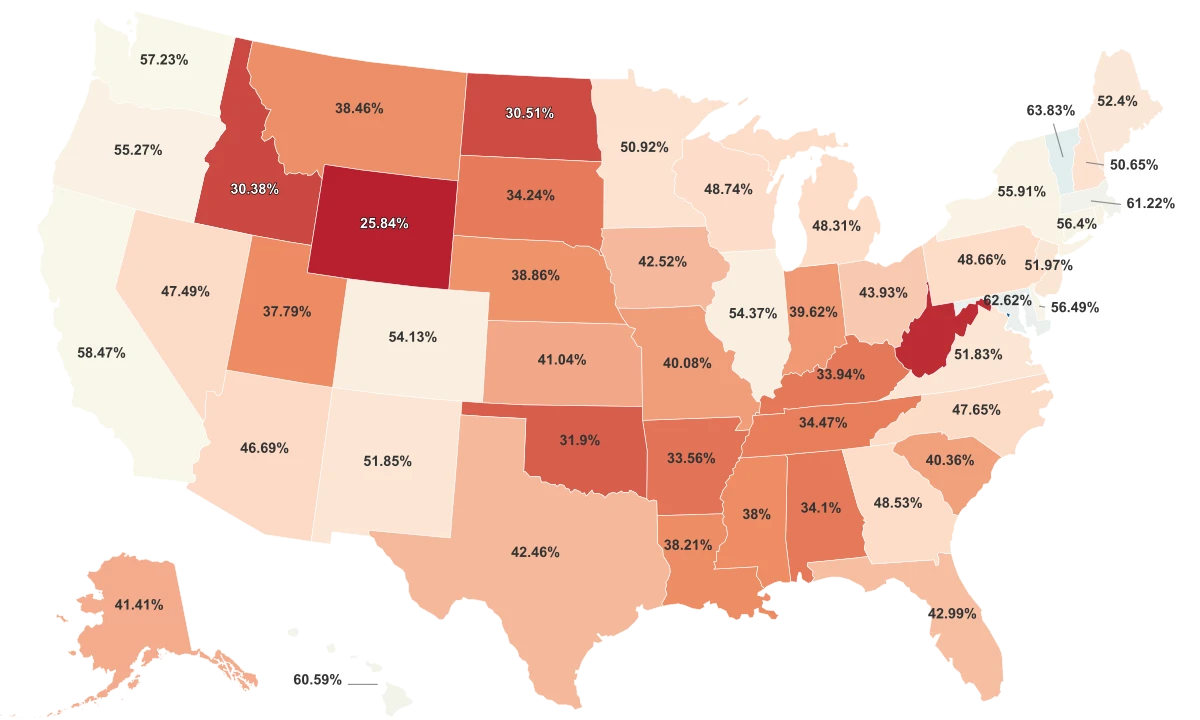
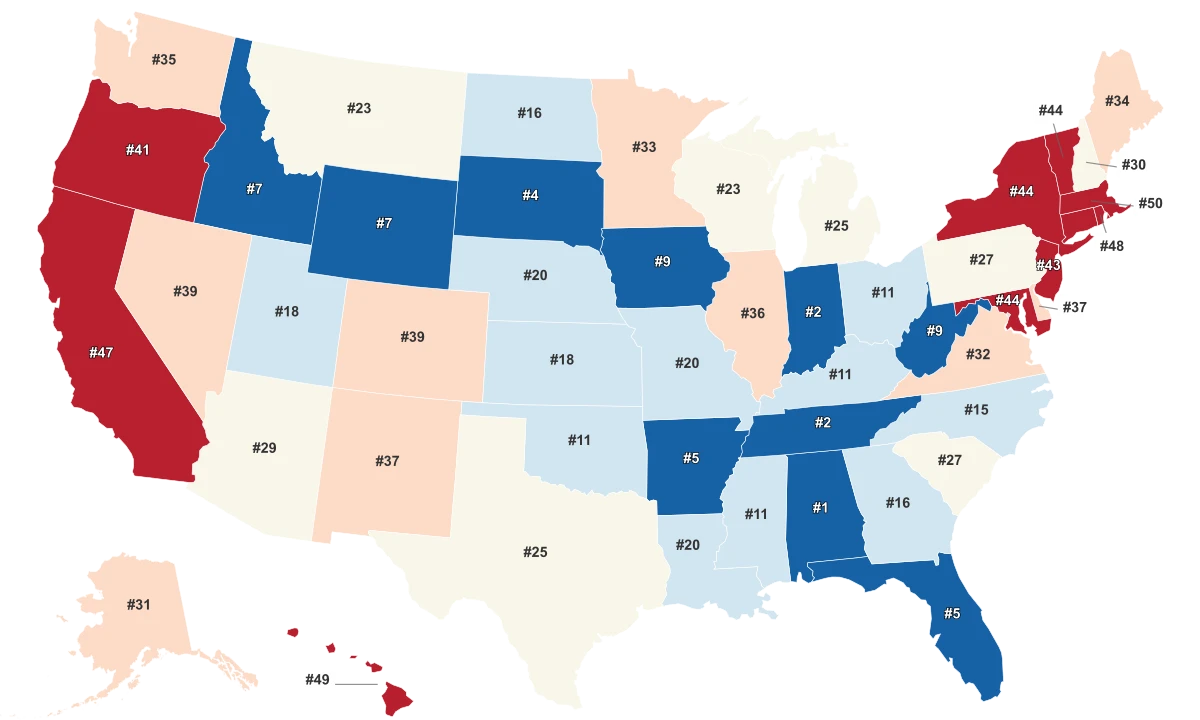
In the ever-evolving political landscape of the United States, states lean toward a spectrum of political ideologies, from conservative 'red states', more neutral 'swing states', to progressive 'blue states'. The liberal ranking is a distinctive approach, giving us an insight into the states with a significant number of liberals compared to conservatives, essentially representing America's 'blue states'.
- The Northeastern region of the United States demonstrates a more liberal inclination, with six out of the top ten most liberal states - Massachusetts, Rhode Island, Vermont, New York, New Jersey, and Connecticut - clustered in this area. Indeed, Massachusetts, marked with a score of 85, stands out as the most liberal state in the country, home to the socially progressive city of Boston.
- The West Coast also demonstrates a strong liberal pattern with states like California and Oregon ranking highly on the liberal index, underscoring the area's reputation for more socially and politically progressive policies.
- Some states traditionally known as 'swing states', such as Colorado and Nevada, appear in the top half of the liberal rankings, revealing a potential trend towards a more definite liberal orientation.
All Metrics
| Region ↕ | Liberal Ranking↕ | Cook Partisan Voter Index 2020↕ | Harris Votes 2024↕ | Governor Political Party 2024↕ |
|---|---|---|---|---|
| Massachusetts | 85 | D+15 | 61.22% | Democratic |
| Hawaii | 81 | D+14 | 60.59% | Democratic |
| Rhode Island | 80 | D+8 | 55.54% | Democratic |
| California | 76 | D+13 | 58.47% | Democratic |
| New York | 74 | D+10 | 55.91% | Democratic |
| Maryland | 74 | D+14 | 62.62% | Democratic |
| Vermont | 74 | D+16 | 63.83% | Republican |
| New Jersey | 73 | D+6 | 51.97% | Democratic |
| Connecticut | 70 | D+7 | 56.4% | Democratic |
| Oregon | 68 | D+6 | 55.27% | Democratic |
| Nevada | 65 | R+1 | 47.49% | Republican |
| Colorado | 65 | D+4 | 54.13% | Democratic |
| Delaware | 64 | D+7 | 56.49% | Democratic |
| New Mexico | 64 | D+3 | 51.85% | Democratic |
| Illinois | 63 | D+7 | 54.37% | Democratic |
| Washington | 61 | D+8 | 57.23% | Democratic |
| Maine | 60 | D+2 | 52.4% | Democratic |
| Minnesota | 56 | D+1 | 50.92% | Democratic |
| Virginia | 55 | D+3 | 51.83% | Republican |
| Alaska | 54 | R+8 | 41.41% | Republican |
| New Hampshire | 49 | D+1 | 50.65% | Republican |
| Arizona | 47 | R+2 | 46.69% | Democratic |
| Pennsylvania | 46 | R+2 | 48.66% | Democratic |
| South Carolina | 46 | R+8 | 40.36% | Republican |
| Texas | 42 | R+5 | 42.46% | Republican |
| Michigan | 42 | R+1 | 48.31% | Democratic |
| Montana | 41 | R+11 | 38.46% | Republican |
| Wisconsin | 41 | R+2 | 48.74% | Democratic |
| Missouri | 39 | R+10 | 40.08% | Republican |
| Nebraska | 39 | R+13 | 38.86% | Republican |
| Louisiana | 39 | R+12 | 38.21% | Republican |
| Utah | 36 | R+13 | 37.79% | Republican |
| Kansas | 36 | R+10 | 41.04% | Democratic |
| North Dakota | 35 | R+20 | 30.51% | Republican |
| Georgia | 35 | R+3 | 48.53% | Republican |
| North Carolina | 34 | R+3 | 47.65% | Democratic |
| Mississippi | 32 | R+11 | 38% | Republican |
| Oklahoma | 32 | R+20 | 31.9% | Republican |
| Kentucky | 32 | R+16 | 33.94% | Democratic |
| Ohio | 32 | R+6 | 43.93% | Republican |
| Iowa | 31 | R+6 | 42.52% | Republican |
| West Virginia | 31 | R+22 | 28.1% | Republican |
| Wyoming | 30 | R+25 | 25.84% | Republican |
| Idaho | 30 | R+18 | 30.38% | Republican |
| Florida | 29 | R+3 | 42.99% | Republican |
| Arkansas | 29 | R+16 | 33.56% | Republican |
| South Dakota | 28 | R+16 | 34.24% | Republican |
| Indiana | 27 | R+11 | 39.62% | Republican |
| Tennessee | 27 | R+14 | 34.47% | Republican |
| Alabama | 26 | R+15 | 34.1% | Republican |
Sources & Notes
Cook Partisan Voter Index
A measurement of how partisan a U.S.
Keep reading


