.png)
.svg)
Copper Production By Country
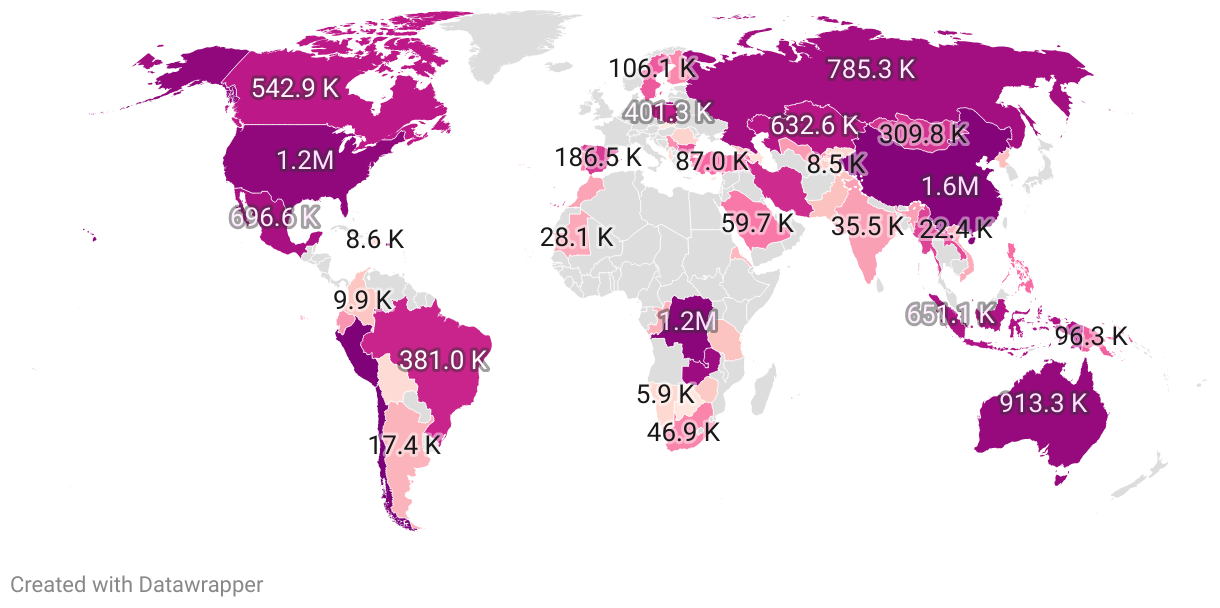

Charting Copper Production Around The Globe
Copper, a versatile and essential metal that has been employed by human civilization for thousands of years, remains imperative in contemporary society. Its high thermal and electrical conductivity renders it vital for industries such as electronics, telecommunication, and construction. Considered the third most consumed industrial metal globally, copper’s application stretches from making electrical wires to forming rain-proof roofs. Despite its abundant presence in the Earth's crust, copper doesn't occur naturally in usable amounts. Instead, it must be extracted from a myriad of ores, a process that is economically significant and technically complex.
Accurate data regarding annual copper production by countries globally plays a pivotal role in shaping international economic policies, understanding the exhaustion and availability of this invaluable resource and forecasting future trends in the copper industry.
Key findings:
- Chile stands unrivaled as the world's largest producer of copper with an astounding 5.8 million metric tons, dwarfing other countries. This is likely due to Chile's extensive copper ore reserves, skilled labor force, and advanced extraction techniques.
- While South America is a dominant player in copper production with Peru holding the second spot by producing 2.4 million metric tons of copper, Asia (China and DR Congo) and North America (United States), also make significant contributions.
- Despite its vast mineral wealth, Africa, as a continent, lags in copper production with only DR Congo and Zambia featuring in the top seven producers. This could be due to infrastructural constraints and lack of adequate investment in mining technology.
- At the lower end of the scale, some countries produce copper in only thousands of metric tons, such as Cyprus and Slovakia, reflecting scarce reserves, undersized mining industry or a focus on other resources.
- Market demand, geopolitical factors, environmental regulations, and technological advancements likely influence production volumes and global rankings, a dynamic situation that warrants constant monitoring and analysis.
Top Copper Producing Countries
By Country
Full Data Set
Frequently Asked Questions
Methodology
Need the full dataset or have any questions? Our team is happy to help. Contact us at: [email protected]