.png)
.svg)
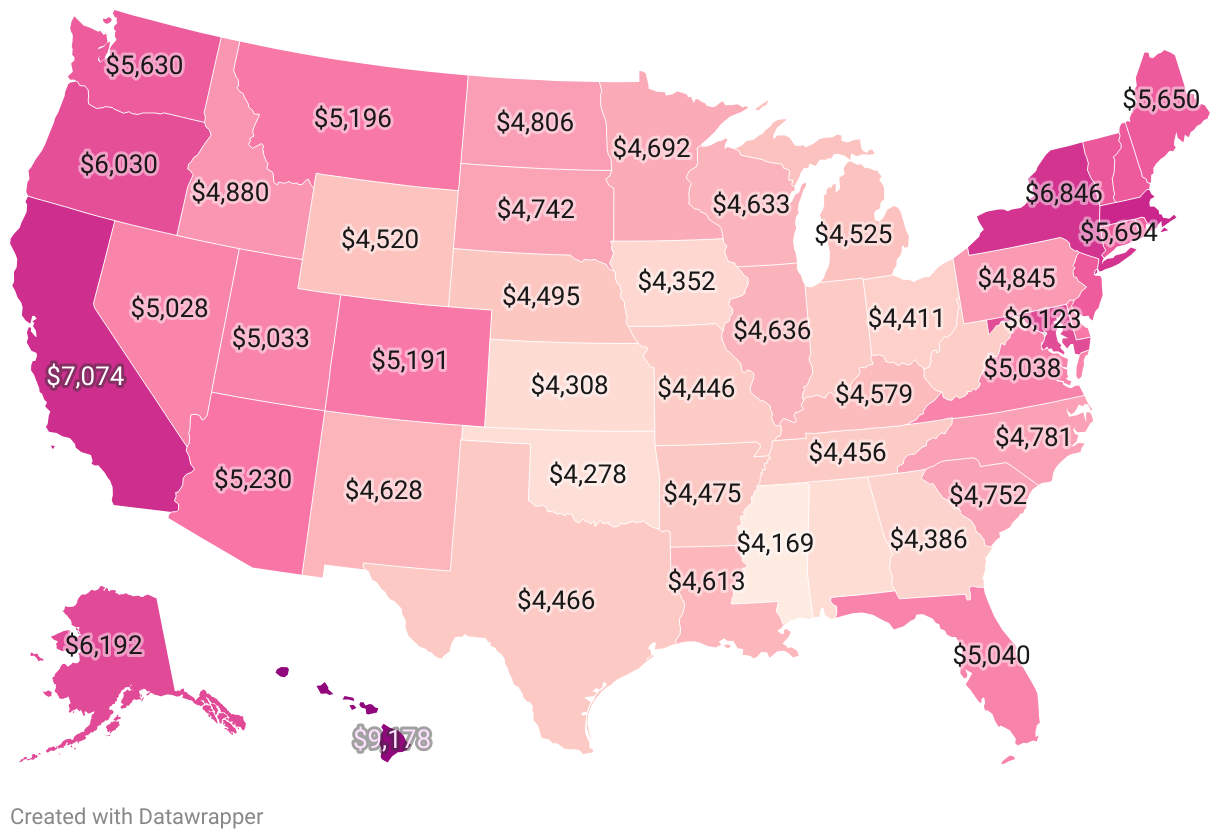
Cost Of Illegal Immigration By State

Introduction
Considering that the United States is home to the third largest population in the world—with a significant portion comprised of immigrants—it's no surprise that immigrant populations and associated costs are a topic of ongoing discussion and scrutiny. Particularly in the context of unauthorized immigration, the financial implications can vary considerably by state. Moreover, with a significant increase of unauthorized entries in the US, rising by 1.13 million between 2020 and 2022, it becomes imperative to analyze this data across all states.
- The cost of unauthorized immigration varies significantly by state. For instance, the taxpayer cost per immigrant in Hawaii—the highest in the nation—is more than double that in Mississippi, which has the lowest costs.
- Many states that share a border with Mexico—such as California, Texas, and Arizona—have some of the highest costs associated with unauthorized immigration. Yet, New Mexico, despite being a border state, ranks 32nd.
- At $7,074, California has the third-highest taxpayer costs per immigrant in the U.S. Yet, when taking total costs into account, California’s overall expenses due to unauthorized immigration are colossal, amounting to a staggering $21.76 billion annually. That represents approximately 8% of the estimated total cost of unauthorized immigration to the U.S., which was reported to be around $250 billion in 2018.
- Despite not being typical entry points, states such as New York, New Jersey, and Florida also bear some of the highest costs associated with unauthorized immigration.
- Interestingly, Illinois stands as the fifth-highest state in terms of costs, despite not being an obvious destination for unauthorized immigrants.
Full Data Set
Frequently Asked Questions
Methodology
Need Help?:
Need the full dataset or have any questions? Our team is happy to help. Contact us at: [email protected]
Need the full dataset or have any questions? Our team is happy to help. Contact us at: [email protected]